
2025–26 HBCSD State Test Results and California School Dashboard

Each fall, the State of California shares results that show how students and schools are doing. The California Department of Education released two important reports: our students’ state test results from last spring and the California School Dashboard. We’re excited to share what they show, and what they mean for your child.
State Test Results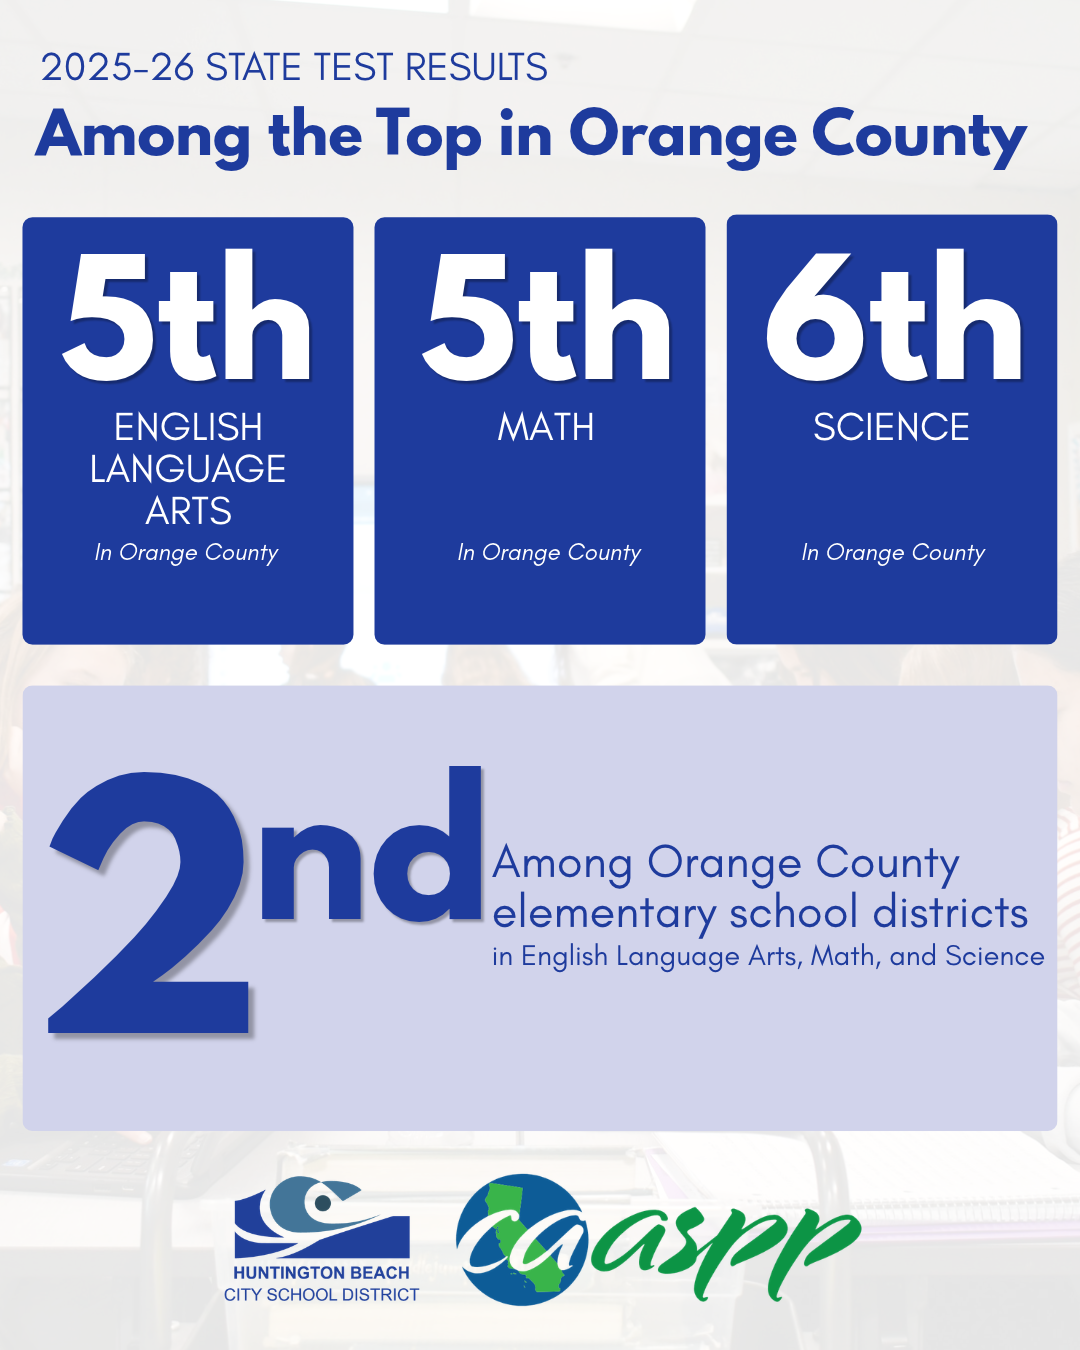
What are the state tests?
Every spring, students in grades 3–8 take the California Assessment of Student Performance and Progress, or CAASPP, in English Language Arts (reading and writing) and Math. Students in grades 5 and 8 also take the California Science Test (CAST). These tests are one way to see how well students are learning important grade-level skills.
How did HBCSD do?
Our students continue to perform well above both Orange County and the State of California. HBCSD ranks 5th in Orange County in English Language Arts and Math, and 6th in Science.
Among elementary school districts in the county, HBCSD ranks 2nd in all three subjects.
English Language Arts and Math
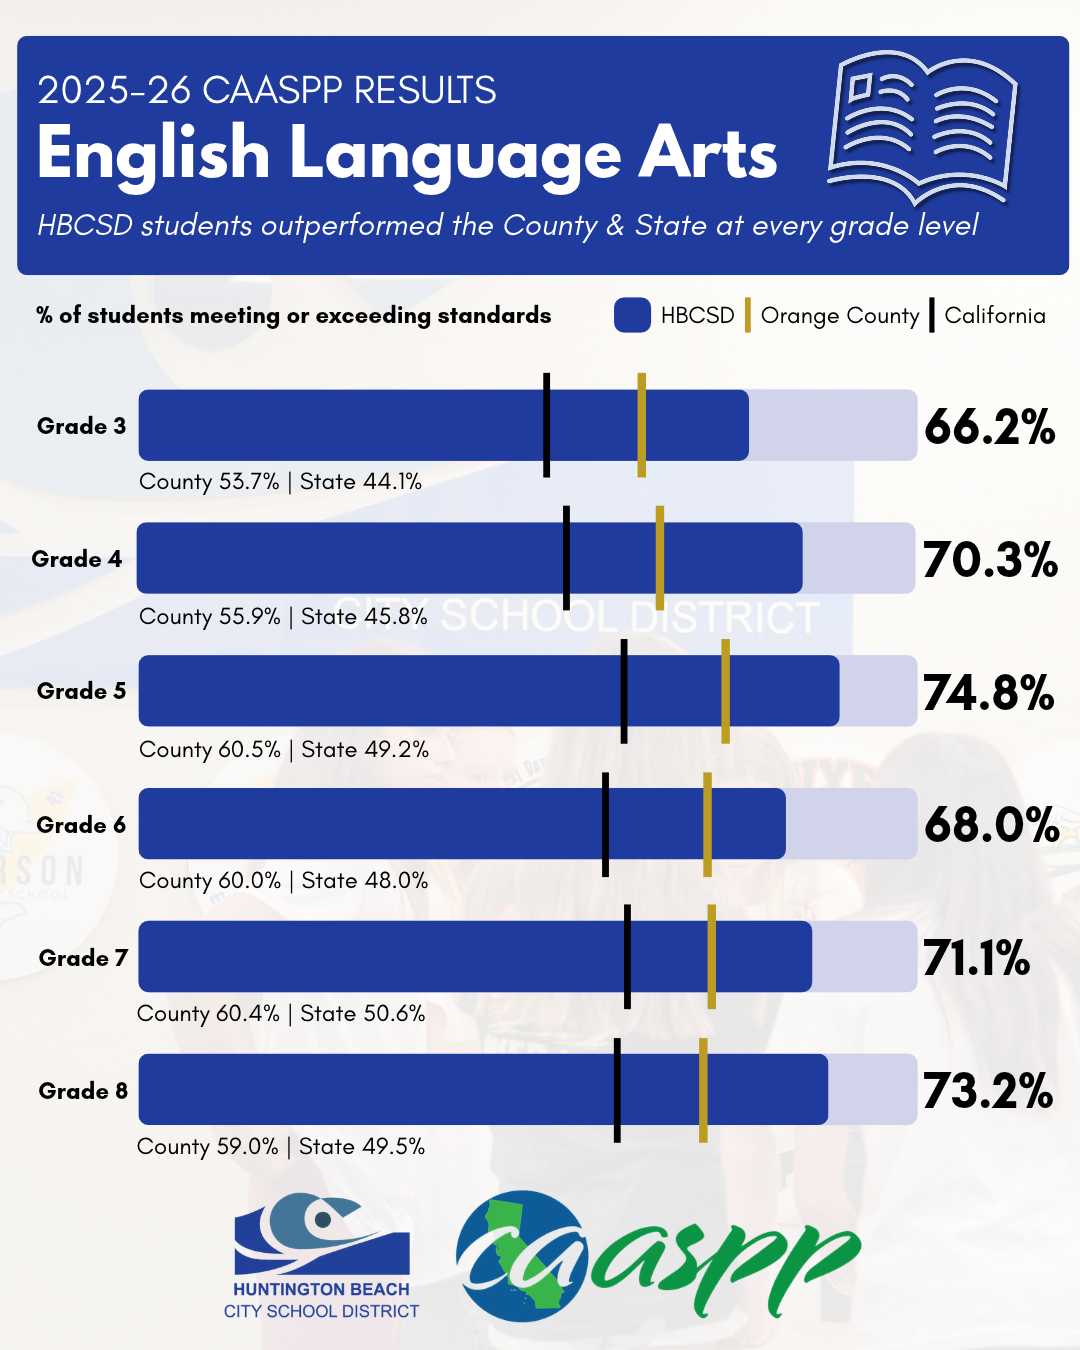
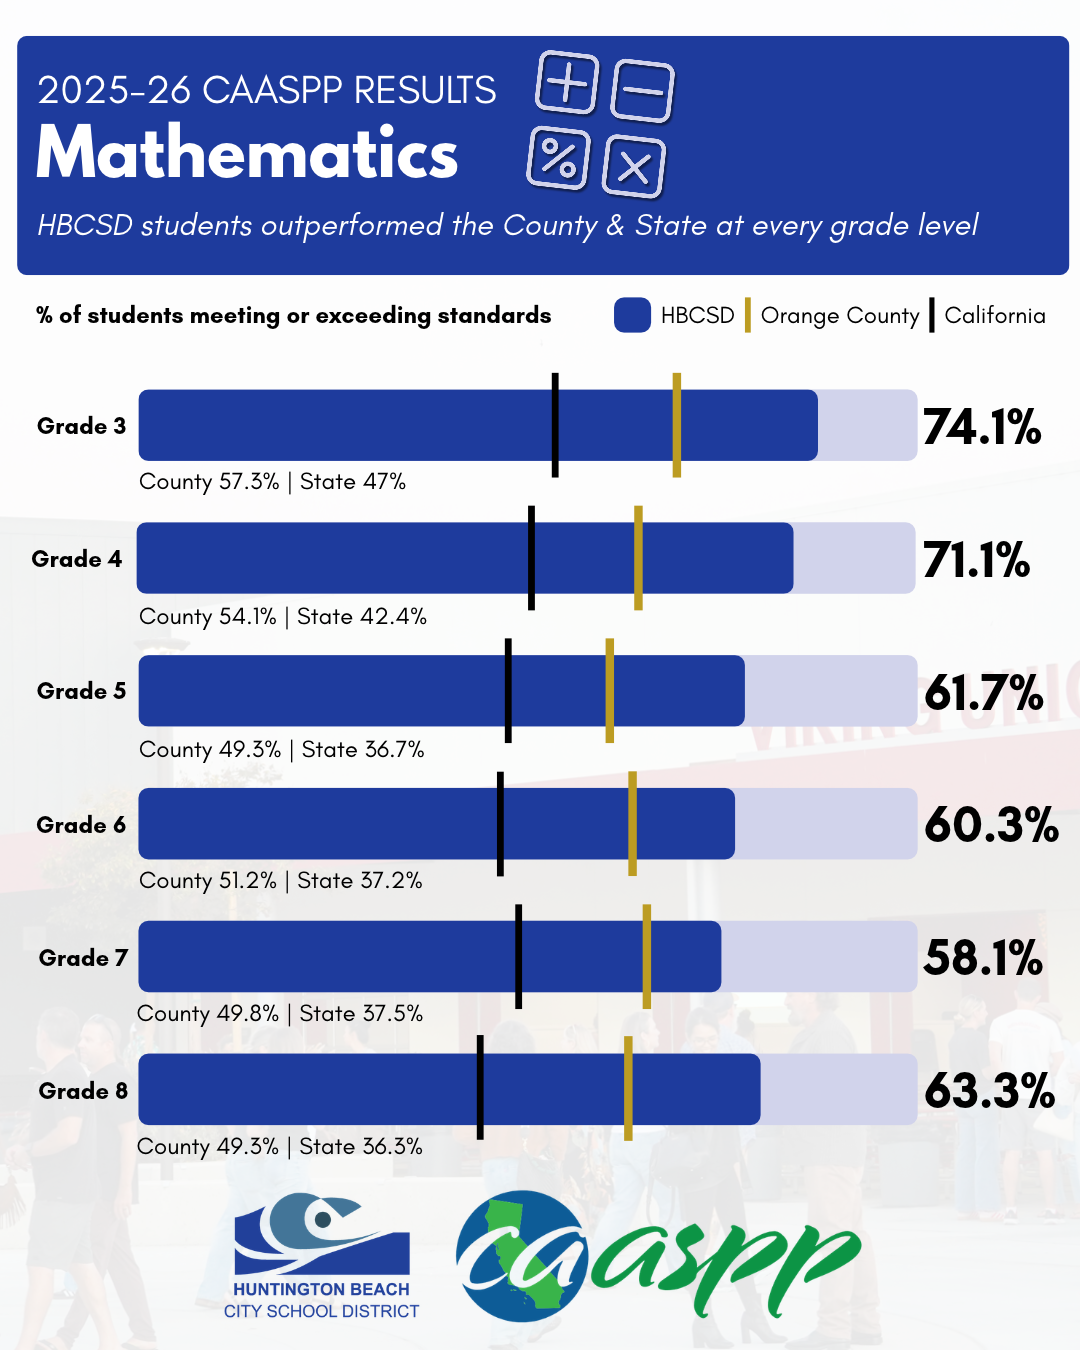
At every grade level, from 3rd through 8th grade, a higher share of HBCSD students met or exceeded grade-level standards than students across Orange County and California. In both subjects, roughly six to seven out of every ten HBCSD students met or exceeded standards, compared with about five to six out of ten students countywide.
Science
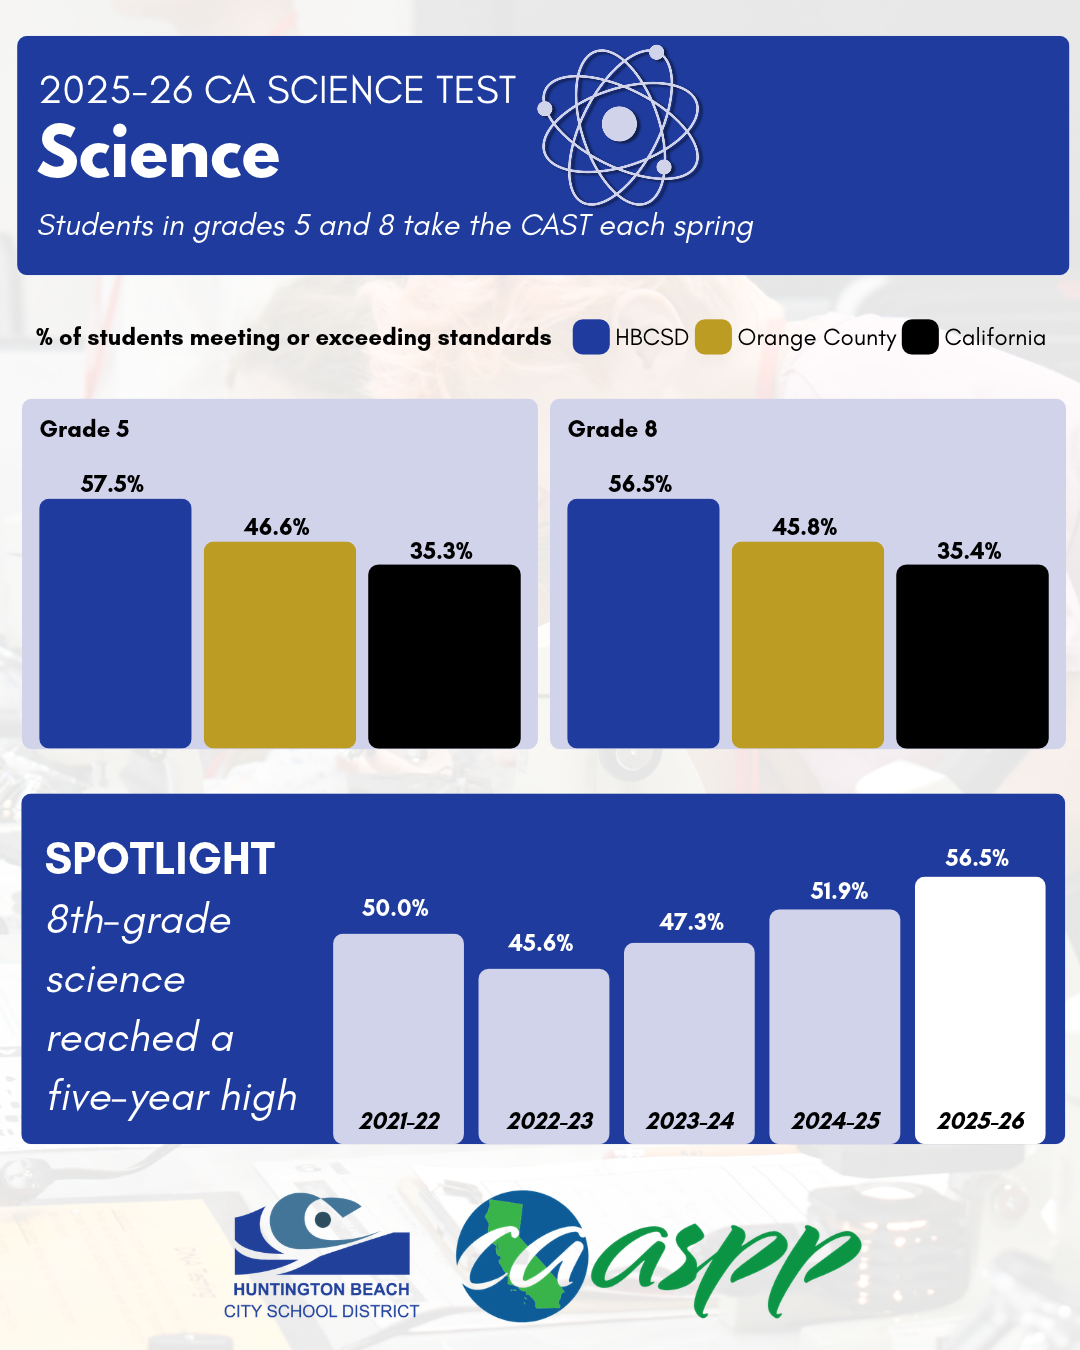
Our 5th and 8th grade students also outperformed the County and State on the California Science Test. Our 8th graders had an especially strong year, reaching their highest science results in the past five years.
|
|
|
California School Dashboard
What is the California School Dashboard?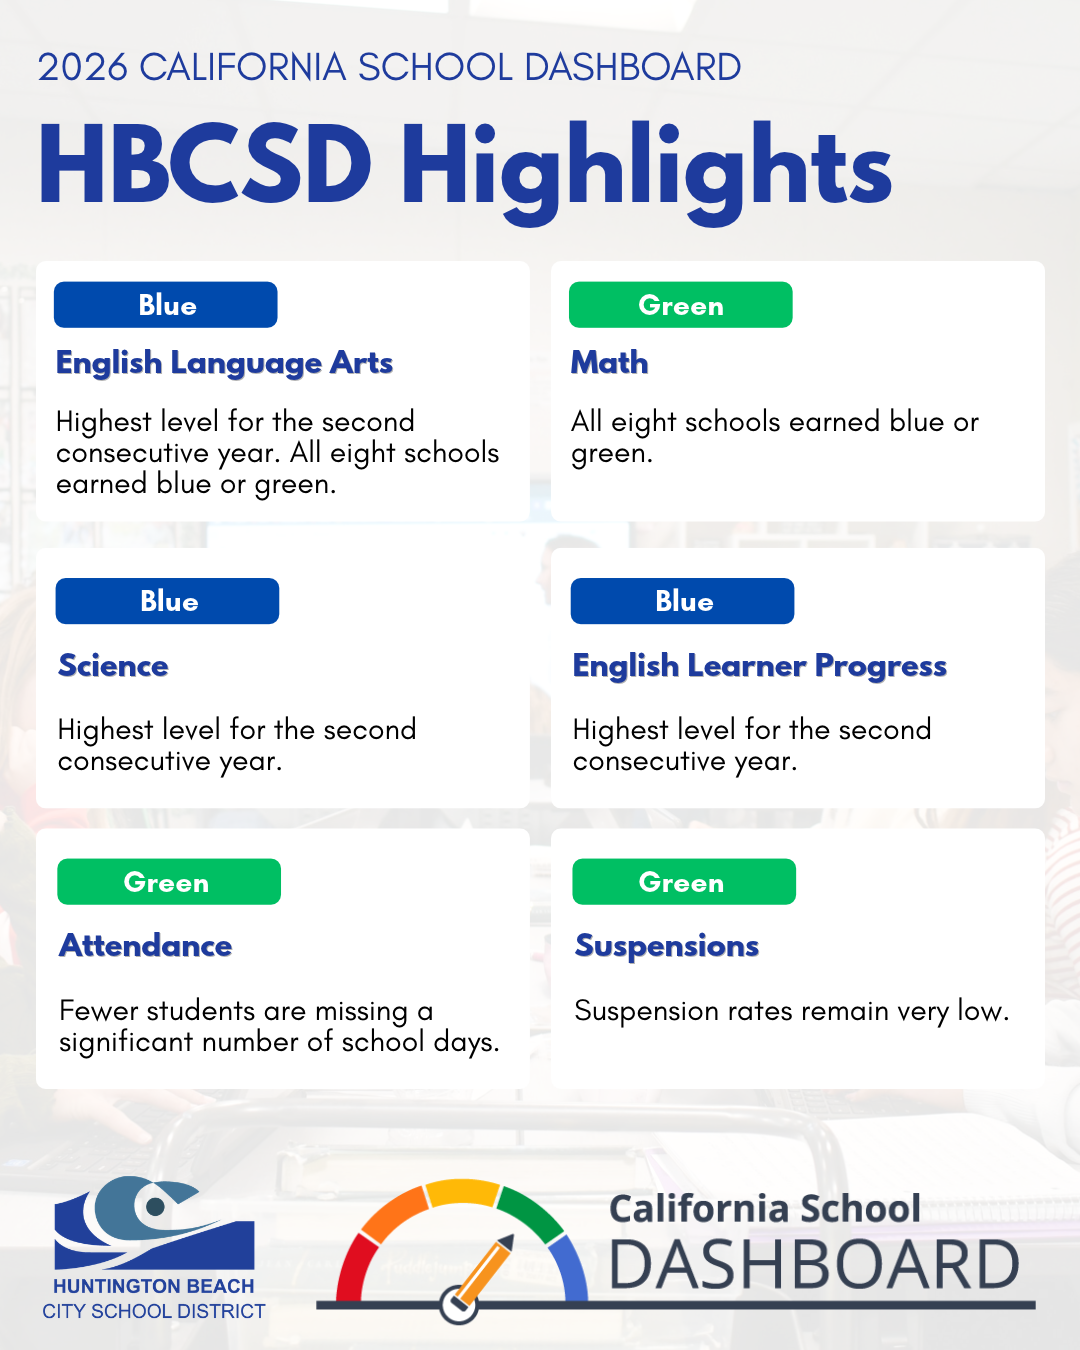
The Dashboard is the state’s report card for schools and districts. It goes beyond test scores, looking at things like attendance, student discipline, and how well students learning English are progressing. Results are shown using five colors, from Blue (the highest level) to Green, Yellow, Orange, and Red (the lowest level).
Highlights to celebrate
Reading and Writing: HBCSD and all eight of our schools earned Blue or Green. This is the second year in a row our District reached Blue, the highest level.
Math: HBCSD and all eight schools earned Blue or Green.
Science: For the second year in a row, HBCSD earned Blue.
Attendance and Student Behavior: HBCSD earned Green in both areas. Fewer students are missing a significant number of school days, and suspensions remain very low.
English Learners: For the second year in a row, HBCSD earned Blue for how well students learning English are growing in their skills and moving out of English learner support.
How we use these results
These results help us celebrate our successes and also show us where we can continue to grow. Since the start of the school year, our principals and teachers have been reviewing early results to reflect on their teaching, set goals for this year, and find students who may benefit from extra support.
To learn more about these results, visit the California School Dashboard to see results for your child’s school. Families of students in grades 3–8 can view their child’s individual score report through the Aeries Parent Portal.
“These results reflect the hard work of our students, the dedication of our teachers and staff, and the support of our families,” said Assistant Superintendent of Educational Services, Dr. Cynthia Guerrero.
Thank you for your continued partnership in your child’s learning. We’re proud of our students and grateful to be part of such a supportive school community.